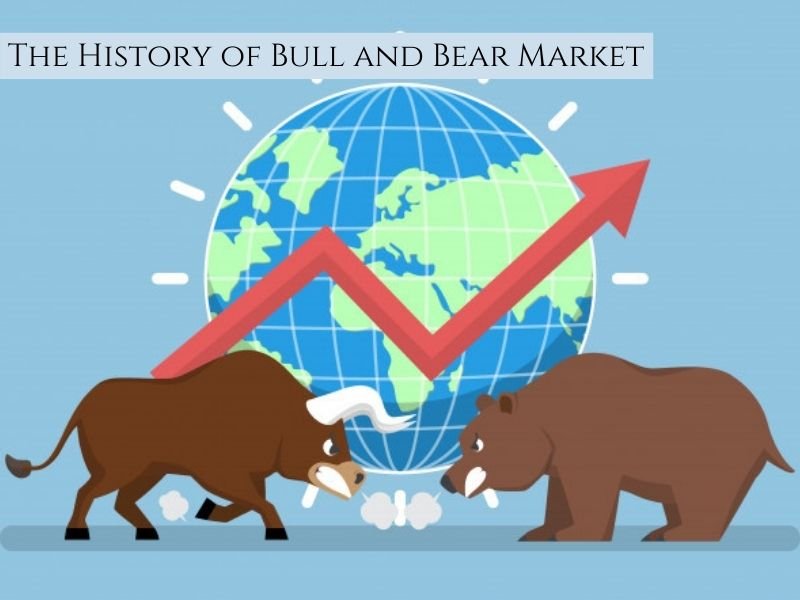
Every market follows two market trends Bull and Bear. The terms Bull and Bear came into existence in the 18th century in England. These terms Bulls and Bears are referred to by the name of the animals because of their attacking position of prey and used to describe the market condition.
A bull stands straight and keeps his head down but horns upward straight in the air, which means now the prices are low, but they are going to rise soon. Or Bull Market is one in which the prices are initially low and then go high. A bull market is appreciating in value.
On the other hand, a bear stands straight and attacks the victim by keeping his claws downwards and tearing the flash, which shows that now the prices are high, but there will be a crash in prices. Or the Bear market is one in which prices are currently high and then go low. A bear market is depreciating in the value.
Most of the historical shreds of evidence show that the bear came into existence before the bull. In the early seventeenth century, the term “Bearskin” used in terms to sell and “Bearskin jobber” used for one who is selling.
Bear Market
When the economy of the country is falling, the rate of unemployment increases, time of recession, and prices of the stocks are declining, this market trend is known as Bear market. A market is considered as an actual bear market until there is 20% or more declination in the prices of stocks from recent highs.
The bear market shows recessions, unemployment and poverty in the nation. A bear market does not last long, but it could be dangerous to invest. But for some investors, a bear trend is the best opportunity to invest in those stocks which were out of budget at the time of the bull market. They buy good stocks at lower rates and wait until bull hits the market and makes a significant profit from this type of deal.
Bear Market Indicators
- Depressed and sluggish economic growth
- Decreasing stock prices
- Higher unemployment rates
- More investors take short positions
- Raising interest rates
- Tightened credit condition
- Inverted yield curve
- Long-term growth expectations changes
History of Market Crashes
Here is a list of the events when the Bear hit the market mightily and caused drastic loss to the market.
| Event | Year | Percentage Change |
| Wall street crash | 1929 | -33.6% |
| End of Gold Standard | 1931 | -26.7% |
| World War II | 1940 | -24.6% |
| Post-WWII Demand Shock | 1946 | -16.9% |
| Black Monday | 1987 | -31.3% |
| LTCM | 1998 | -8.7% |
| Dot-Com Bubble | 2002 | -19.3% |
| Lehman Crisis | 2008 | -25.2% |
| Great Financial Crisis | 2009 | -13.8% |
| US Debt Downgrade | 2011 | -16.7% |
| COVID 19 Outbreak | 2020 | -20.7% |
Bull Market
When the economy of the country is booming, the prices of stocks are going high, and there is a rise of 20% or more from the latest low point, this market trend is known as Bull Market. The bull market shows the prosperity of the nation. Bull markets tend to last for more extended periods and make much larger magnitudes than bear markets.
In the bull market, the condition of the economy is generally favourable. At the time of bull, the investors stay calm and enjoy their investment rising until they smell a bear coming forward.
Bull Market Indicators
- High national income
- A rise in stock price
- Reduced unemployment rates
- More and more investors take long positions.
- Low-interest rates
- Technology is on the boom.
- Industrial production statistics are higher.
- S&P 500 shows higher lows and higher highs
History of Bull Markets
Here is the list of events and years when the bull was in his full form and bounced the market up in the sky with its full throttle.
| Event | Start Date | Months | S&P 500 Percent Change |
| Recovery from wall street crash | June 1932 | 57 | 325% |
| World War II | April 1942 | 49 | 158% |
| Post War Boom | June 1949 | 89 | 266% |
| Cold War Ramps up | October 1957 | 50 | 86% |
| JFK aims to get America moving again | June 1962 | 44 | 80% |
| The go-go years | October 1966 | 26 | 48% |
| Nifty Fifty | May 1970 | 32 | 74% |
| A Modest Bull | October 1974 | 74 | 126% |
| Reaganomics | August 1982 | 60 | 229% |
| Black Monday Comeback | December 1987 | 31 | 65% |
| Roaring 90s | October 1990 | 113 | 417% |
| Housing Boom | October 2002 | 60 | 102% |
| Long, Slow recovery | March 2009 | 131 | 348% |
Bottom Line
There are two sides to everything one is positive, and one is negative. People define positive and negative according to their views of living life, and the same concept is applied to bull and bear markets. For some inventors, the bear market is the best opportunity and for some bull is the one. Both play an essential role and are considered beneficial and detrimental according to the perspective of the person.

